


RRDMA Statistics
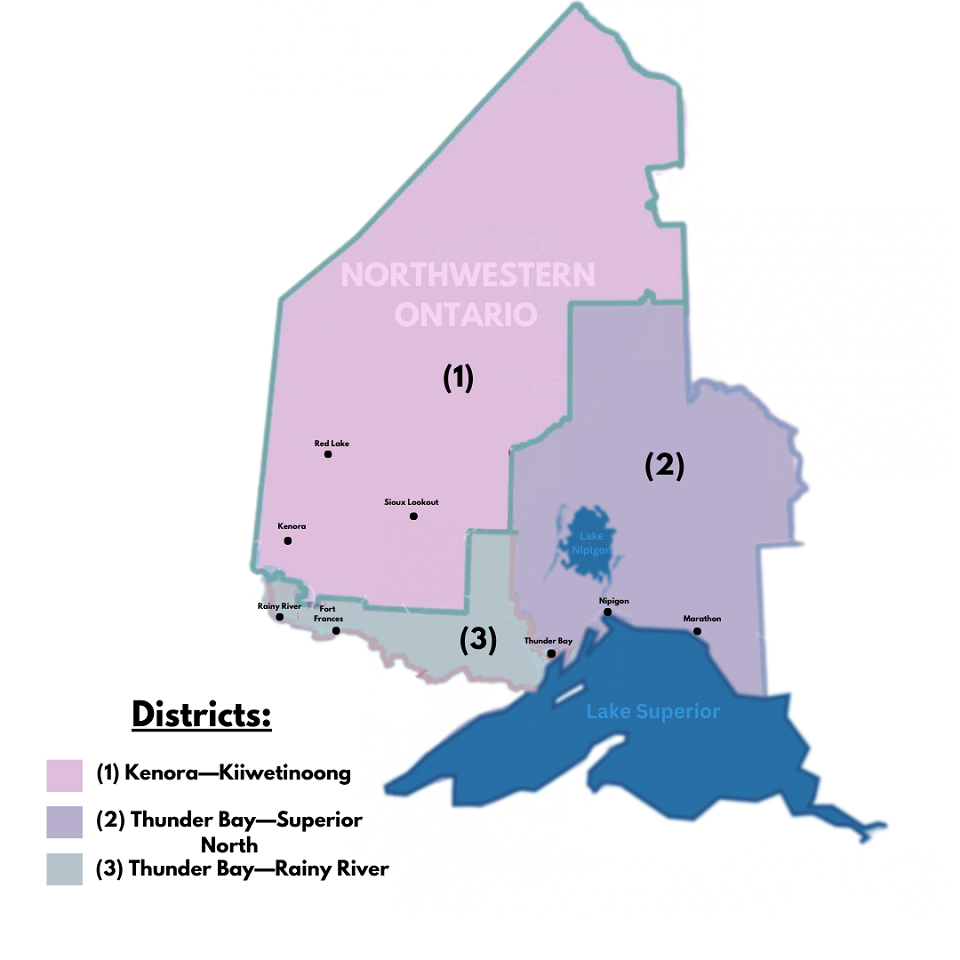
Northwestern Ontario is divided into three districts, which include Kenora, Rainy River and Thunder Bay District. Northwestern and each of its
regions and communities are all beautiful, with different cultures, ideals, and priorities,however, they all work together to
develop and make Northwestern Ontario a great place to live, work, and visit.
Rainy River District:
The Rainy River District is formed of 15,486.75 km2, with a population density of 1.3 population/km2. It was founded in 1885 and is well-known for being close to the US border 8. It is renowned for its great fishing opportunities, further, the largest communities located in the district are Fort Frances and Atikokan. They are investing to improve their economic growth and create more jobs for those within the communities and for newcomers living within their area.
The municipalities within the district are:
1. Township of Alberton
- Population (2016): 969
- Population (2021): 954
- Population Percentage change, 2016 to 2021: -1.5 %
- Population Density per square kilometre: 8.2 population/Km²
- Land area: 116.60 Km²
2. Town of Atikokan
- Population (2016): 2,753
- Population (2021): 2,642
- Population Percentage change, 2016 to 2021: -4.0 %
- Population Density per square kilometre: 8.4 population/Km²
- Land area: 313.64 Km²
3. Township of Chapple
- Population (2016): 643
- Population (2021): 763
- Population Percentage change, 2016 to 2021: 18.7 %
- Population Density per square kilometre: 1.4 population/Km²
- Land area: 558.15 Km²
4. Township of Dawson
- Population (2016): 468
- Population (2021): 399
- Population Percentage change, 2016 to 2021: -14.7 %
- Population Density per square kilometre: 1.2 population/Km²
- Land area: 343.42 Km²
5. Township of Emo
- Population (2016): 1,333
- Population (2021): 1,204
- Population Percentage change, 2016 to 2021: -9.7 %
- Population Density per square kilometre: 6.0 population/Km²
- Land area: 202.28 Km²
6. Town of Fort Frances
- Population (2016): 7,466
- Population (2021): 7,739
- Population Percentage change, 2016 to 2021: -3.5 %
- Population Density per square kilometre: 292.2 population/Km²
- Land area: 25.55 Km²
7. Township of La Vallee
- Population (2016): 938
- Population (2021): 788
- Population Percentage change, 2016 to 2021: - 16 %
- Population Density per square kilometre: 3.3 population/Km²
- Land area: 237.12 Km²
8. Township of Lake of the Woods
- Population (2016): 230
- Population (2021): 308
- Population Percentage change, 2016 to 2021: 33.9 %
- Population Density per square kilometre: 0.4 population/Km²
- Land area: 746.24 Km²
9. Township of Morley
- Population (2016): 481
- Population (2021): 493
- Population Percentage change, 2016 to 2021: 2.5 %
- Population Density per square kilometre: 1.3 population/Km²
- Land area: 388.38 Km²
10. Town of Rainy River
- Population (2016): 807
- Population (2021): 725
- Population Percentage change, 2016 to 2021: -6.8 %
- Population Density per square kilometre: 241.4 population/Km²
- Land area: 3.12 Km²