


TBDML Statistics
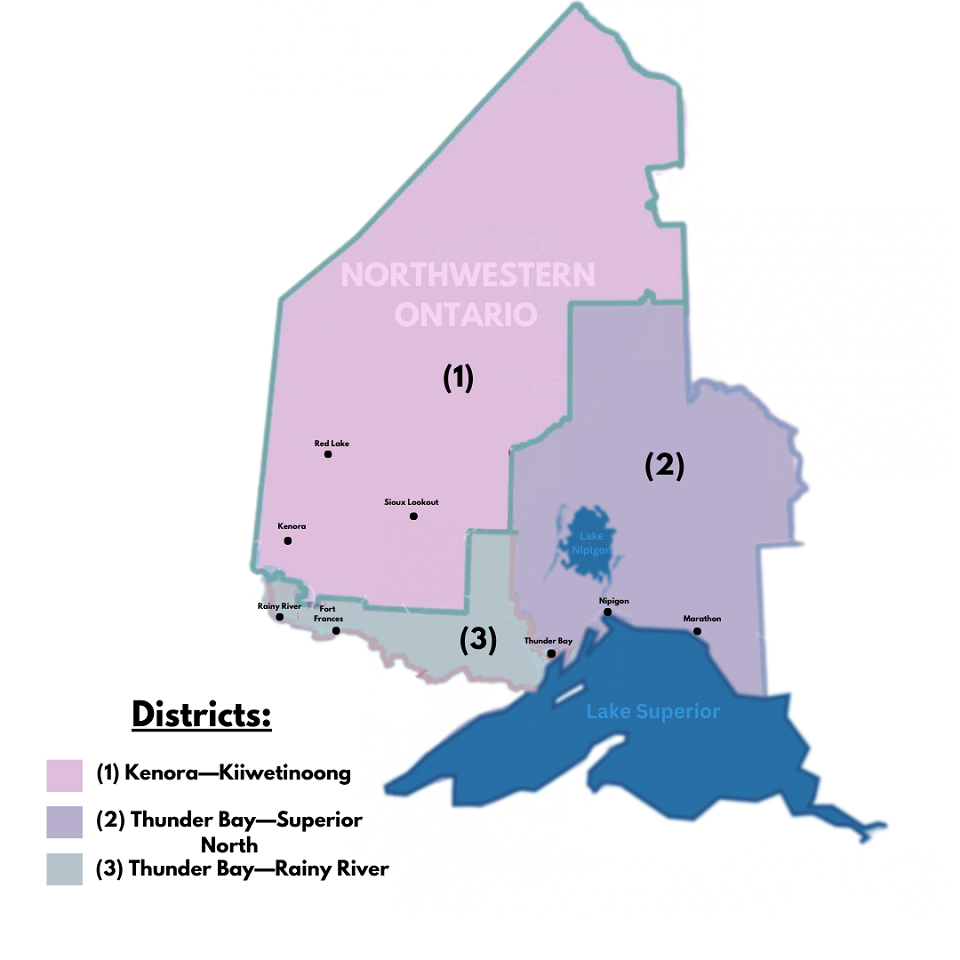
Northwestern Ontario is divided into three districts, which include Kenora, Rainy River and Thunder Bay District. Northwestern and each of its regions and communities are all beautiful, with different cultures, ideals, and priorities, however, they all work together to develop and make Northwestern Ontario a great place to live, work, and visit.
Thunder Bay District:
The Thunder Bay District is 103,719.51 km2 and has a population density of 1.4 population/km2. It was founded in 1871 and its largest communities include Thunder Bay, Oliver Paipoonge and Greenstone 9. The main economic drives for the district include manufacturing, mining, forestry, and tourism.
The municipalities within the district are:
1. Township of Conmee
- Population (2016): 819
- Population (2021): 798
- Population Percentage change, 2016 to 2021: -2.6 %
- Population Density per square kilometre: 4.8 population/Km²
- Land area: 167.65 Km²
2. Township of Dorion
- Population (2016): 316
- Population (2021): 375
- Population Percentage change, 2016 to 2021: 18.7 %
- Population Density per square kilometre: 1.8 population/Km²
- Land area: 211.25 Km²
3. Town of Hearst (Northeastern Ontario)
- Population (2016): 5,070
- Population (2021): 4,794
- Population Percentage change, 2016 to 2021: -5.4 %
- Population Density per square kilometre: 48.9 population/Km²
- Land area: 98.06 Km²
4. Township of Hornepayne (Northeastern Ontario)
- Population (2016): 980
- Population (2021): 968
- Population Percentage change, 2016 to 2021: -1.2 %
- Population Density per square kilometre: 4.8 population/Km²
- Land area: 203.04 Km²
5. Township of Gillies
- Population (2016): 474
- Population (2021): 441
- Population Percentage change, 2016 to 2021: -7.0 %
- Population Density per square kilometre: 4.8 population/Km²
- Land area: 92.68 Km²
6. Municipality of Greenstone
- Population (2016): 4,636
- Population (2021): 4,309
- Population Percentage change, 2016 to 2021: -7.2 %
- Population Density per square kilometre: 1.6 population/Km²
- Land area: 2,727.04 Km²
7. Township of Manitouwadge
- Population (2016): 1,937
- Population (2021): 1,974
- Population Percentage change, 2016 to 2021: 1.4 %
- Population Density per square kilometre: 5.6 population/Km²
- Land area: 325.17 Km²
8. Town of Marathon
- Population (2016): 3,273
- Population (2021): 3,138
- Population Percentage change, 2016 to 2021: -4.1 %
- Population Density per square kilometre: 18.8 population/Km²
- Land area: 167.03 Km²
9. Municipality of Neebing
- Population (2016): 2,055
- Population (2021): 2,241
- Population Percentage change, 2016 to 2021: 9.1 %
- Population Density per square kilometre: 2.6 population/Km²
- Land area: 873.78 Km²
10. Township of Nipigon
- Population (2016): 1,642
- Population (2021): 1,473
- Population Percentage change, 2016 to 2021: -10.3 %
- Population Density per square kilometre: 13.6 population/Km²
- Land area: 107.94 Km²
11. Township of O’Connor
- Population (2016): 663
- Population (2021): 689
- Population Percentage change, 2016 to 2021: 3.9 %
- Population Density per square kilometre: 6.3 population/Km²
- Land area: 108.56 Km²
12. Municipality of Oliver Paipoonge
- Population (2016): 5,922
- Population (2021): 6,035
- Population Percentage change, 2016 to 2021: 1.4%
- Population Density per square kilometre: 17.2 population/Km²
- Land area: 305.51 Km²
13. Township of Red Rock
- Population (2016): 895
- Population (2021): 895
- Population Percentage change, 2016 to 2021: 0.0 %
- Population Density per square kilometre: 14.4 population/Km²
- Land area: 62.10 Km²
14. Township of Schreiber
- Population (2016): 1,059
- Population (2021): 1,039
- Population Percentage change, 2016 to 2021: -1.9 %
- Population Density per square kilometre: 29.0 population/Km²
- Land area: 35.81 Km²
15. Municipality of Shuniah
- Population (2016): 2,798
- Population (2021): 3,247
- Population Percentage change, 2016 to 2021: 16.0 %
- Population Density per square kilometre: 5.7 population/Km²
- Land area: 571.34 Km²
16. Township of Terrace Bay
- Population (2016): 1,611
- Population (2021): 1,528
- Population Percentage change, 2016 to 2021: -5.2 %
- Population Density per square kilometre: 10.1 population/Km²
- Land area: 151.51 Km²
17. City of Thunder Bay
- Population (2016): 107,909
- Population (2021): 108,843
- Population Percentage change, 2016 to 2021:0.9 %
- Population Density per square kilometre: 332.1 population/Km²
- Land area: 327.77 Km²
18. Township of White River
- Population (2016): 645
- Population (2021): 557
- Population Percentage change, 2016 to 2021: -13.6 %
- Population Density per square kilometre: 5.8 population/Km²
- Land area: 95.55 Km²