


KDMA Statistics
Northwestern Ontario is divided into three districts, which include Kenora, Rainy River and Thunder Bay District. Northwestern and each of its regions and communities are all beautiful, with different cultures, ideals, and priorities, however, they all work together to develop and make Northwestern Ontario a great place to live, work, and visit.
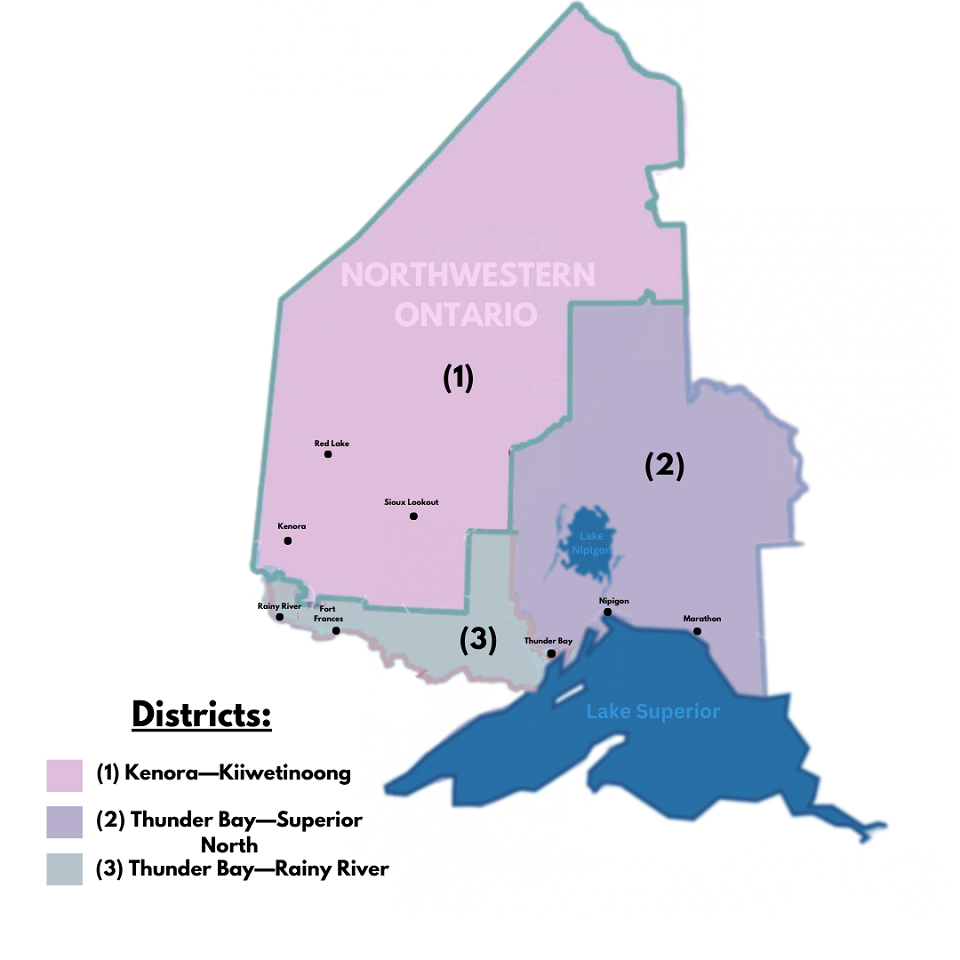
Kenora District:
The Kenora District with 407,213.01 km2 is geographically the largest division in Ontario 7. The largest communities located here are Kenora, Dryden and Sioux Lookout, still all the 9 municipalities work together to achieve shared goals and meet common challenges. Their largest economic driver is mining and some agriculture with the production of Bartley. The population near the North of the district does native traditional activities like hunting and fishing.
The municipalities within the district are:
1. City of Dryden
- Population (2016): 7,749
- Population (2021): 7,388
- Population Percentage change, 2016 to 2021: -4.7 %
- Population Density per square kilometre: 112.7 population/Km²
- Land area: 65.58 Km²
2. Township of Ear Falls
- Population (2016): 995
- Population (2021): 924
- Population Percentage change, 2016 to 2021: -7.1 %
- Population Density per square kilometre: 2.7 population/Km²
- Land area: 336.69 Km²
3. Township of Ignace
- Population (2016): 1,202
- Population (2021): 1,206
- Population Percentage change, 2016 to 2021: 0.3 %
- Population Density per square kilometre: 16.7 population/Km²
- Land area: 72.13 Km²
4. City of Kenora
- Population (2016): 15,096
- Population (2021): 14,967
- Population Percentage change, 2016 to 2021: -0.9 %
- Population Density per square kilometre: 70.7 population/Km²
- Land area: 211.65 Km²
5. Township of Machin
- Population (2016): 971
- Population (2021): 1,012
- Population Percentage change, 2016 to 2021: 4.2 %
- Population Density per square kilometre: 3.5 population/Km²
- Land area: 290.14 Km²
6. Township of Pickle Lake
- Population (2016): 388
- Population (2021): 398
- Population Percentage change, 2016 to 2021: 2.6 %
- Population Density per square kilometre: 1.6 population/Km²
- Land area: 247.21 Km²
7. Municipality of Red Lake
- Population (2016): 4,107
- Population (2021): 4,094
- Population Percentage change, 2016 to 2021: -0.3 %
- Population Density per square kilometre: 6.8 population/Km²
- Land area: 602.93 Km²
8. Municipality of Sioux Lookout
- Population (2016): 5,272
- Population (2021): 5,839
- Population Percentage change, 2016 to 2021: 10.8 %
- Population Density per square kilometre: 15.4 population/Km²
- Land area: 378.02 Km²
9. Township of Sioux Narrows - Nestor Falls
- Population (2016): 567
- Population (2021): 727
- Population Percentage change, 2016 to 2021: 28.2 %
- Population Density per square kilometre: 0.6 population/Km²
- Land area: 1,215.80 Km²